A year after Hurricane Harvey, some Texans are using outdated flood risk maps to rebuild
- Written by Wanyun Shao, Assistant Professor of Geography, University of Alabama
One year ago, on August 25, 2017, Hurricane Harvey struck Texas – the first major hurricane to make landfall in the United States since Wilma in 2005[1]. Harvey dumped record-breaking rain[2] and flooded hundreds of thousands of homes in and around Houston. It caused some US$125 billion in damages[3], making it one of the costliest natural disasters in U.S. history.
But human choices played a role. Before Harvey, Houston was widely known as a model of unchecked urban development[4]. With no formal zoning or comprehensive plan[5], developers were allowed to turn virtually any land, including wetlands, into houses and shopping malls. The National Flood Insurance Program[6], administered by the Federal Emergency Management Agency (FEMA), unintentionally encouraged intense development by offering coverage in flood-prone areas at below-cost rates[7].
Harvey’s impacts in Houston provide an ideal case study for unsustainable human-environment interaction. After last year’s flooding, it would be logical to expect affected communities to rethink long-term hazard management and risk reduction.
In fact, I see the opposite happening. In just one example, officials in the city of Friendswood (part of greater Houston) are allowing some residents to rebuild their homes based on outdated flood risk maps[8] that greatly underestimate the risk of future floods. This avoids requirements such as elevating houses and buying flood insurance. I believe choosing to rely on faulty information, driven by short-term financial concerns, will increase long-term risks for many Houstonians.
The message of FEMA flood maps
Much discussion about the troubled National Flood Insurance Program has centered on its artificially low premiums[9]. FEMA’s flood risk maps receive less attention, but are a powerful risk communication tool.
FEMA produces these maps for more than 20,000 communities that participate in the insurance program. They determine insurance rates, inform local regulations and communicate risks to communities[10]
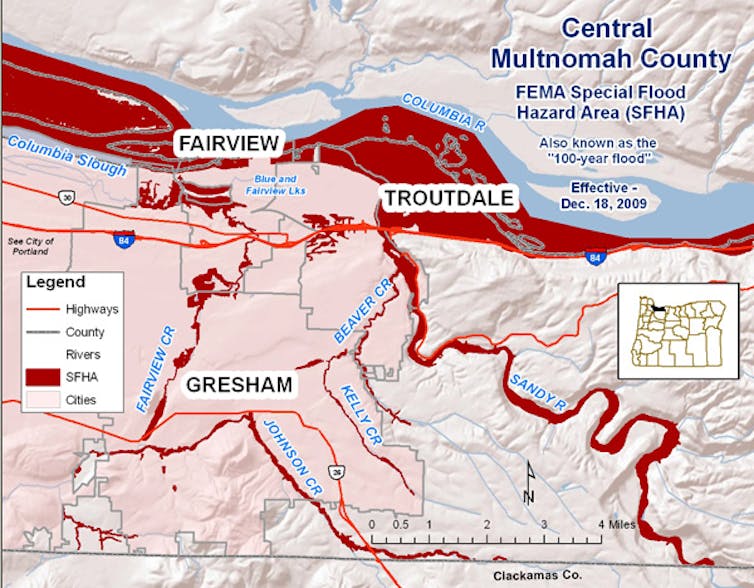
On the maps, Special Flood Hazard Areas identify zones with a one percent chance of flooding in any given year. Since this translates to 100 percent odds of flooding at least once in a century, these areas often are referred to as 100-year flood zones (creating the misleading impression[11] that they will only flood once a century). Homeowners there must buy flood insurance in order to qualify for federally regulated or guaranteed loans.
 Flood risk map for Multnomah County, Oregon, based on FEMA hazard assessment.
Oregon DCLD[12]
Using surveys and geographic data, I have shown that flood maps significantly affect voluntary decisions to purchase flood insurance[13]. Working with other social scientists and engineers, I found that people who live in communities with a large percentage of 100-year flood zones are more likely to buy flood insurance, even when they are not required to do so.
How do these maps convey risk? Using websites such as Floodsmart.gov[14], users can view the flood maps and see threats to their properties and surrounding areas. FEMA also works with local governments to educate residents about flood risks. A civil engineer who worked for the city of Huntsville, Alabama told me that he used the maps to point out relative risks to homeowners:
“I’ll say, ‘Do you have flood insurance? You don’t have to – your house isn’t in [a 100-year flood zone] – but you do have one-percent annual chance floodplain on the back of your property. It’s close to where you are, so you have more risk of flooding than somebody further away.’”
When homeowners elevate or flood-proof their homes or purchase flood insurance, they may also influence neighbors to take similar steps[15].
Some Houstonians who are not required to elevate their homes are choosing to do so.Undercutting FEMA’s message
FEMA’s maps can be a double-edged sword. If they are inaccurate, they may mislead users.
And the maps have widely-recognized flaws. They do a poor job of accounting for changing conditions[16]. For instance, FEMA often assigns low flood risk to locations that are near coasts but slightly elevated, due to insufficient wave modeling to account for storm surge risk[17]. This can give residents in those zones a false sense of security. And the maps do not analyze how risks vary within flood zones, or between coastal and inland locations.[18].
FEMA is required to assess whether the maps need updating maps every five years. But a recent Congressional Budget Office report found that two-thirds of counties with high flood-related claims had maps that were more than five years old[19]. The update process is time-consuming, with a lengthy statutory consultation and appeals process[20].
Even if communities have more recent data, FEMA will not publish a partial update[21]. This explains why Friendswood – which has an updated flood map for some land within its limits, created after Tropical Storm Allison in 2007 – can revert to a 20-year-old FEMA map to guide post-Harvey rebuilding.
Downplaying risks
Friendswood is just one example of Houston officials downplaying flood risks. FEMA maps are developed and updated in partnership with communities; in recent years the agency has allowed Houston developers to revise local flood maps through steps such as dumping tons of fill to raise neighborhoods above the flood plain[22] – sometimes just by inches.
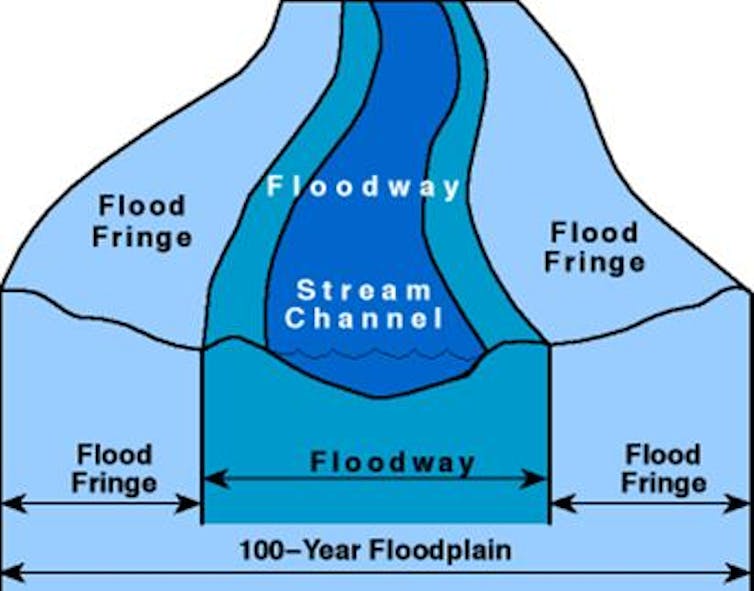
Today, a developer in Friendswood is planning to build a shopping center in the Clear Creek floodway – the zone around the creek where most of the water flows – on top of trucked-in dirt[23]. In the past decade, some 1,400 structures have been permitted in and around Houston in floodways[24].
A pro-building, pro-expansion mentality still permeates the city. Despite opposition from some residents and local media[25], Houston’s City Council unanimously approved a plan in April 2018 to build 900 homes in a west Houston flood plain[26].
 A floodway is land along a creek, stream or river that conveys most of the water, so flow is deepest, fastest and most dangerous.
Boulder County, Colorado[27]
Houston is taking some steps to reduce flood risks[28], such as buying out houses that have routinely flooded and requiring other owners to elevate their homes. Nonetheless, these pro-development examples are troubling.
According to one recent study, the extreme amounts of rain that fell on Houston during Harvey resulted from unprecedented ocean heat content[29]. In other words, it was exacerbated by human-induced climate change. In a climate where temperatures are projected to increase in the future, hurricane-induced coastal flooding will be more frequent and intense[30].
My recent research shows that even with their flaws, FEMA flood maps influence decisions to purchase flood insurance and overall support for flood mitigation. Policy makers need to seriously consider how to accurately communicate increasing flood risks to the public. Reverting to old flood maps and granting variances to promote development is a recipe for more disasters down the road.
References
- ^ Wilma in 2005 (en.wikipedia.org)
- ^ rain (theconversation.com)
- ^ US$125 billion in damages (www.nhc.noaa.gov)
- ^ unchecked urban development (qz.com)
- ^ no formal zoning or comprehensive plan (kinder.rice.edu)
- ^ National Flood Insurance Program (www.fema.gov)
- ^ coverage in flood-prone areas at below-cost rates (theconversation.com)
- ^ outdated flood risk maps (www.houstonchronicle.com)
- ^ artificially low premiums (www.gao.gov)
- ^ determine insurance rates, inform local regulations and communicate risks to communities (www.fema.gov)
- ^ misleading impression (fivethirtyeight.com)
- ^ Oregon DCLD (www.oregonriskmap.com)
- ^ voluntary decisions to purchase flood insurance (doi.org)
- ^ Floodsmart.gov (www.floodsmart.gov)
- ^ influence neighbors to take similar steps (resolver.ebscohost.com)
- ^ accounting for changing conditions (www.bloomberg.com)
- ^ insufficient wave modeling to account for storm surge risk (link.springer.com)
- ^ coastal and inland locations. (doi.org)
- ^ had maps that were more than five years old (www.cbo.gov)
- ^ lengthy statutory consultation and appeals process (fas.org)
- ^ will not publish a partial update (www.houstonchronicle.com)
- ^ dumping tons of fill to raise neighborhoods above the flood plain (www.nytimes.com)
- ^ on top of trucked-in dirt (www.houstonchronicle.com)
- ^ permitted in and around Houston in floodways (www.houstonchronicle.com)
- ^ opposition from some residents and local media (www.houstonpublicmedia.org)
- ^ build 900 homes in a west Houston flood plain (www.chron.com)
- ^ Boulder County, Colorado (www.bouldercounty.org)
- ^ taking some steps to reduce flood risks (www.reuters.com)
- ^ resulted from unprecedented ocean heat content (doi.org)
- ^ hurricane-induced coastal flooding will be more frequent and intense (doi.org)
Authors: Wanyun Shao, Assistant Professor of Geography, University of Alabama

