Ozone pollution in US national parks is nearly the same as in large cities
- Written by David Keiser, Assistant Professor of Economics, Iowa State University
“Another glorious day, the air as delicious to the lungs as nectar to the tongue” – John Muir, My First Summer in the Sierra (1911)
Most Americans associate U.S. national parks with pristine environments that represent the very best of nature. In the 1916 law that established the National Park Service, Congress directed the new agency[1] to “conserve the scenery and the natural and historic objects and the wild life therein and to provide for the enjoyment of the same in such manner and by such means as will leave them unimpaired for the enjoyment of future generations.”
But over the past century it has become increasingly hard to protect the parks from impacts of human activities outside their boundaries. In 2015 the National Parks Conservation Association[2], a national advocacy group, released a blistering report[3] giving many popular parks poor grades for unhealthy air, haze and impacts from climate change.
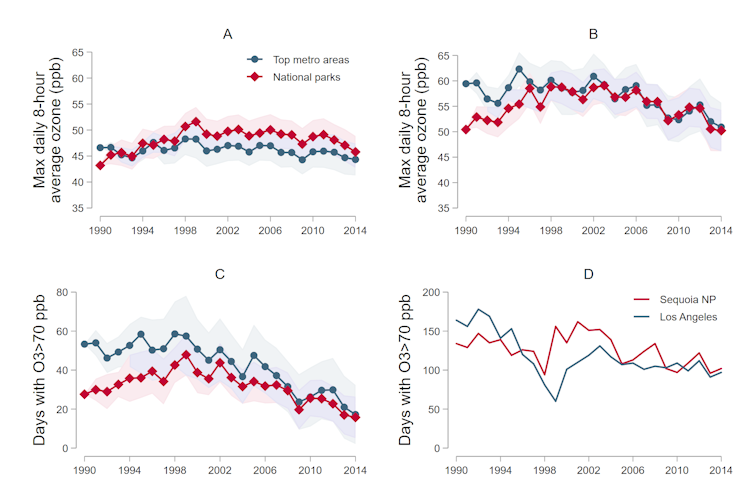
In a study just published in Science Advances[4], we analyzed levels of ozone, the most widely monitored pollutant in parks, and their impact on visits to 33 national parks from 1990 to 2014. The sites we studied included popular parks such as Acadia[5], the Grand Canyon[6], Great Smoky Mountains[7], Joshua Tree[8], Sequoia and Kings Canyon[9] and Yosemite[10]. We found that while cities once had more “bad air days” with unhealthy ozone levels than national parks, today parks and metro areas have virtually the same number of unhealthy ozone days per year on average. We also found that park visits fall on high ozone days – especially during summer and fall, when peak ozone levels typically occur.
 Trends in ozone concentrations and unhealthy ozone days. (A) Average annual maximum daily 8-hour ozone concentrations. (B) Average summertime maximum daily 8-hour ozone concentrations. (C) Average days per year with maximum daily 8-hour ozone concentrations exceeding 70 ppb. (D) Unhealthy ozone days at Sequoia National Park and the Los Angeles metro area.
Keiser et al., Science Advances eaat1613, 18 July 2018, CC BY-NC[11]
The impact of bad air days
Regulatory efforts to protect the national parks have a long history. The Clean Air Act Amendments of 1977 and 1990 designated parks as Federal Class I Areas, granting them special air quality and visibility protections[12].
The U.S. Environmental Protection Agency’s 1999 Regional Haze Rule[13] increased these protections by requiring states to develop and implement plans to improve visibility and air quality in parks and wilderness areas.
However, these regulatory actions have spurred contentious debate[14] and litigation[15]. Environmental groups argue that these measures are not stringent enough, while some states and industries call them too costly.
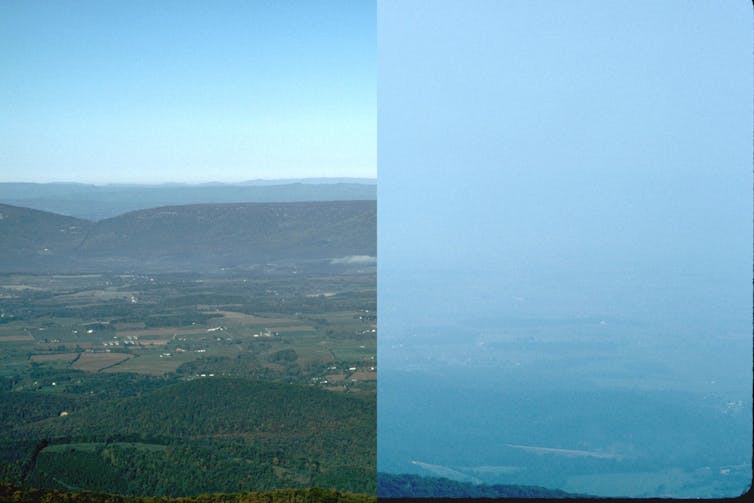
 Looking west from Shenandoah National Park’s Shaver Hollow on clear (left) and hazy (right) days.
NPS[16]
Major sources of park air pollution include power plants, automobiles and industrial facilities. Unlike other pollutants emitted directly from these sources, like sulfur dioxide or lead, ozone is a secondary pollutant[17]. It forms in the atmosphere through chemical reactions between nitrogen oxides[18], volatile organic compounds[19] and sunlight. Nitrogen oxides originate from the usual urban pollution sources, but biogenic sources like trees are actually the largest source of volatile organic compounds[20], above industrial sources and cars.
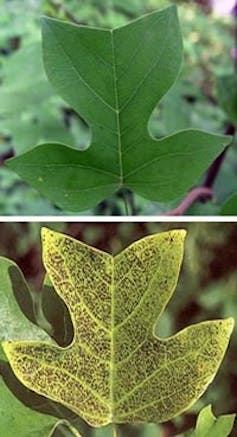
Ozone pollution is a serious threat to human health and the environment. It has been linked to increased respiratory symptoms[21], hospitalization rates[22] and mortality[23]. It also is correlated with poor visibility in parks, and can damage sensitive plant species[24].
Ozone trends over time
To our surprise, for most of our study period we found that average annual ozone concentrations in national parks were nearly identical to those in metropolitan areas. However, summertime levels and the incidence of unhealthy days told a different story.
Since ozone forms in sunlight, levels typically are highest on hot, sunny days. When ozone levels exceed the national standard, which is currently 70 parts per billion[25], local and regional governments may issue alerts or urge people to avoid outdoor activities.
 Healthy (top) and ozone-injured (bottom) tulip tree (yellow poplar) foliage.
NPS[26]
In 1990 cities had far more days bad ozone days on average than national parks. But through the decade, summertime ozone and unhealthy ozone days worsened in national parks. By the year 2000, ozone levels in national parks were, on average, very similar to those in metropolitan areas. Explaining this increase was beyond the scope of our study. According to the National Park Service, pollution in national parks can come from many sources[27], including power plants, industrial sources, vehicle emissions and wildfires.
Since the early 2000s, ozone levels in both national parks and metropolitan areas have improved. But bad air days still occur. On average, among the locations we studied, metro areas currently have 18 unhealthy ozone days per year, while parks have 16.
Bad air days drive away park visitors
To see whether visitors responded to changing ozone levels in the parks, we matched monthly visitation data from the National Park Service with various measures of monthly average ozone levels. We found that a one percent increase in ozone concentrations was associated with approximately a one percent decrease in park visitation on average. This response was most pronounced during summer and fall, when both visitation and average ozone levels are highest.
Why do visits decrease when ozone is high? We see two possibilities. First, visitors may worry about adverse impacts on their health. Second, visibility is typically poor when ozone levels are high because ozone participates in chemical reactions in the air that can form haze[28].
We found stronger evidence that health concerns keep visitors away. Park visitation has a robust negative correlation with the incidence of unhealthy ozone days, perhaps because of air quality warnings that accompany these high levels.
The value of further ozone reductions
Across the United States, ozone levels declined by 31 percent[29] between 1980 and 2016. But city residents and tourists in national parks still experience unhealthy ozone levels for two to three weeks per year. Exposure to high ozone levels may be particularly harmful in national parks, since health effects from ozone are greater during exercise[30], such as hiking, backpacking or rock climbing.
Although we found that some people decrease their visits during unhealthy days, we still observed that since 1990, nearly 80 million visitor days have occurred during high ozone periods. This suggests that improving air quality in U.S. national parks could produce significant human health benefits. We hope that state and federal policy makers will weigh these benefits of improved air quality along with their costs as discussions move forward on air pollution regulations.
References
- ^ Congress directed the new agency (www.nps.gov)
- ^ National Parks Conservation Association (www.npca.org)
- ^ blistering report (www.npca.org)
- ^ just published in Science Advances (advances.sciencemag.org)
- ^ Acadia (www.nps.gov)
- ^ Grand Canyon (www.nps.gov)
- ^ Great Smoky Mountains (www.nps.gov)
- ^ Joshua Tree (www.nps.gov)
- ^ Sequoia and Kings Canyon (www.nps.gov)
- ^ Yosemite (www.nps.gov)
- ^ CC BY-NC (creativecommons.org)
- ^ special air quality and visibility protections (www.nps.gov)
- ^ Regional Haze Rule (www.epa.gov)
- ^ contentious debate (trib.com)
- ^ litigation (www.chamberlitigation.com)
- ^ NPS (www.nps.gov)
- ^ secondary pollutant (www.epa.gov)
- ^ nitrogen oxides (www3.epa.gov)
- ^ volatile organic compounds (www3.epa.gov)
- ^ volatile organic compounds (dx.doi.org)
- ^ respiratory symptoms (dx.doi.org)
- ^ hospitalization rates (doi.org)
- ^ mortality (dx.doi.org)
- ^ damage sensitive plant species (www.nps.gov)
- ^ which is currently 70 parts per billion (www.epa.gov)
- ^ NPS (www.nps.gov)
- ^ can come from many sources (www.nps.gov)
- ^ chemical reactions in the air that can form haze (www.fsvisimages.com)
- ^ declined by 31 percent (www.epa.gov)
- ^ greater during exercise (www.mayoclinic.org)
Authors: David Keiser, Assistant Professor of Economics, Iowa State University

