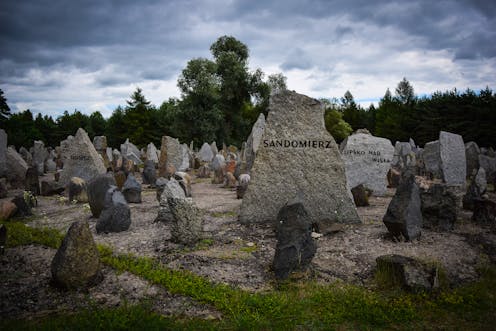
Quantifying the Holocaust: Measuring murder rates during the Nazi genocide
- Written by Lewi Stone, Professor of Biomathematics, RMIT University

Even though the Holocaust is one of the best documented genocides in a historical sense, there is surprisingly little quantitative data[1] available[2], even on major critical events.
What’s more, this history is often[3] told in figures too large to comprehend on the human scale. Large numbers – like the infamous 6 million people murdered – obscure the significance of key operations that shaped this genocide, leaving instead just a vague characterization of a massively devastating event.
In a digital age, mathematics, data science and visualization can help make sense of these events for new generations. By examining a rare and neglected dataset of human train deportations from the period, my study[4], published on Jan. 2, begins to uncover the true scale of slaughter.
Operation Reinhard
My work investigates a period in 1942, referred to as Operation Reinhard[5], when the Nazis efficiently shuttled about 1.7 million victims, often whole Jewish communities, across the European railway network in train carriages to Treblinka, Belzec and Sobibor. Almost all of those who arrived at these death camps were murdered, usually within hours, in the gas chambers. Because the Nazis destroyed nearly all records of the massacre, it is important to try to uncover what actually happened at the time.
My study looks at the “kill rate,” or murders per day. This reveals a sudden massive slaughter after Hitler “ordered all action speeded up,” as one SS officer put it[6], on July 23, 1942. Approximately 1.5 million Jews were murdered in only 100 days, including in shootings outside the death camps, with nearly 500,000 victims killed each month during August, September and October. That’s approximately 15,000 murders every day.
The slaughter then soon terminated, as there were hardly any Jews remaining in the area to kill.
The full scope of this genocidal slaughter appears to be undocumented in history. Available information before this study was mostly reconstructed indirectly, partially conjectured, and usually given on an annual timescale, rather than daily or monthly. That meant completely missing the three-month slaughter.
My analysis was based on carefully compiled train records presented in a 1987 book[7] by Holocaust historian Yitzhak Arad[8]. Arad documents approximately 500 transportations from some 400 different Polish Jewish communities, recording for individual days the location, number of victims of each transportation and final death camp destination.
My analysis required carefully sorting and working with the dataset, as well as including other surviving data. In addition, I generated a spatio-temporal map and film of the data. These visualizations plotted the 400 communities on a map of Poland and indicated the time sequence of all deportations to the death camps over the whole year 1942.
While Operation Reinhard is considered the largest single murder campaign of the Holocaust, the extraordinary speed at which it operated to obliterate the Jewish people has been poorly estimated in the past and almost completely unknown to the general public. This massacre of unparalleled scale took place in just three short months, and was only captured through analysis of Arad’s dataset.
This minimal time indicates the enormous coordination involved by a state machinery responsive to the Fuhrer’s murderous will to eradicate a people. The train records show how zones were emptied of Jewish communities one by one in an organized manner and how intense kill rates were achieved in targeted areas that only slowed as victims ran out. My plots of the data highlight the pace and frenzy of this mass murder.
Measuring genocide
Despite more than 70 years of research into the Holocaust, this appears to be the first attempt to graph aggregated data of the genocide, chronologically and spatially. My data-driven approach captures Operation Reinhard in a different perspective to the volumes of historical reports.
Genocide scholars often compare rates of recent genocides to the rate at which the Nazi Holocaust occurred, treating the latter as a kind of benchmark for genocide severity. As such, currently many social[9] scientists[10] maintain that the Rwandan genocide was the most “intense genocide” of the 20th century, with a sustained period of murders occurring at a rate three to five times more rapid than the Holocaust.
However, my work shows that while the Rwanda massacre killings were 8,000 victims per day for a 100-day period, the Holocaust was nearly double this rate during a similar 100-day period in Operation Reinhard.
That suggests that Holocaust kill rate has been underestimated on an order of six to 10 times. In my view, these sorts of comparisons have limited usefulness, and clearly diminish the Holocaust’s historical standing.
The Holocaust stands out as a demonstration of how the efficient machinery of government was turned on people in an unparalleled way. It transcended in its ruthlessness and systemic efficiency. This is the key lesson of the Holocaust that I believe must not be forgotten.
References
- ^ quantitative data (encyclopedia.ushmm.org)
- ^ available (www.sapiens.org)
- ^ this history is often (encyclopedia.ushmm.org)
- ^ my study (advances.sciencemag.org)
- ^ Operation Reinhard (en.wikipedia.org)
- ^ as one SS officer put it (www.popularmechanics.com)
- ^ in a 1987 book (www.nytimes.com)
- ^ Yitzhak Arad (en.wikipedia.org)
- ^ social (www.vqronline.org)
- ^ scientists (www.theatlantic.com)
Authors: Lewi Stone, Professor of Biomathematics, RMIT University

