Drones to track one of the largest dam removals on the Eastern Seaboard
- Written by Matthew E. Baker, Professor of Geography and Environmental Systems, University of Maryland, Baltimore County
This month, the Bloede Dam will be removed from the Lower Patapsco River near Ilchester, Maryland.
The restoration is a one-of-a-kind natural experiment that will help test how relatively inexpensive drones can help scientists like me understand the integrity of streams and rivers.
My collaborators include students and researchers from the University of Maryland Baltimore County, Maryland Geological Survey, Maryland Department of Natural Resources, National Oceanic and Atmospheric Administration and U.S. Geological Survey.
If our approach works, it will allow us to track sediment movement more completely and accurately than ever before, at a fraction of the expense.
What will change
Completed in 1907 and operational for 30 years, the Bloede Dam contained the first submerged hydroelectric plant in the U.S. At 26.5 feet high, it represents one of the largest dam removals on the Eastern Seaboard.
Why remove the dam? The state[1], federal agencies and nonprofit American Rivers[2] hope to eliminate a derelict public safety hazard.
Taking out the dam will also complement restoration from previous dam removals upstream and expand connected habitat for fish and other aquatic creatures. The Patapsco once hosted major freshwater runs of shad, alewife and American eel, which were blocked by the dam. A fish ladder has proven ineffective at connecting upstream sections of the river with the downstream estuary and the Chesapeake Bay.
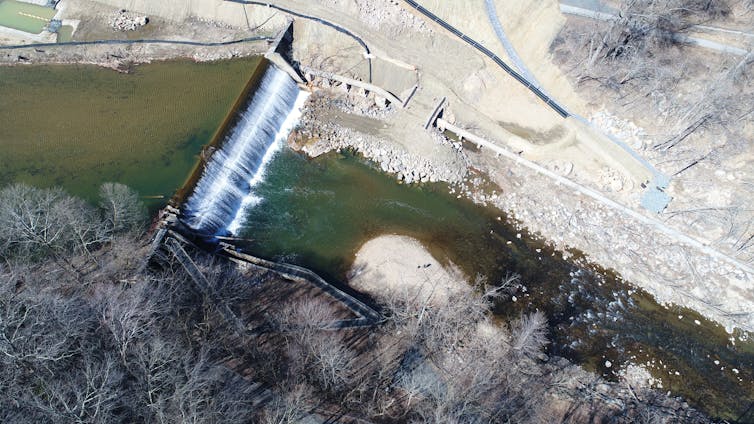
 The Bloede Dam in March. The obsolete fish ladder is in the foreground.
Matthew Baker/UMBC
Despite a prominent role in early U.S. manufacturing, the Patapsco Valley[3] has suffered its share of environmental challenges. Colonial shipping was forced to relocate to Baltimore after the original port at Elkridge Landing[4] was choked by sediment from shipping ballast, river bank mining and upstream forest clearing. Once a 10-foot channel surrounded by a saltwater marsh, today the site is fresh and the channel less than two feet deep.
Periodic floods[5] have also wreaked havoc in the narrow gorge, occasionally with catastrophic[6] results. In the past few years, flash floods[7] just upstream in Ellicott City[8] have ruptured the sewer main that runs along the valley bottom and reorganized large quantities of sand, wood and rock in the downstream channel.
Today, the dam stores approximately 2.6 million cubic feet of stratified silt and sand less than eight miles from Chesapeake Bay tidewater. When the dam is removed, we want to know how this much sediment is going to move and how fast.
Why sediment movement?
Understanding sediment movement[9] is critical for river management in every jurisdiction of the Chesapeake Bay watershed.
Sediment helps balance water flow to maintain channel shape and stable habitats for aquatic plants, invertebrates and fish. River sediment is necessary to help estuarine coastlines combat sea level rise. However, fine sediment can also be a pollutant[10] in, or carry nutrients and heavy metals to, downstream estuaries.
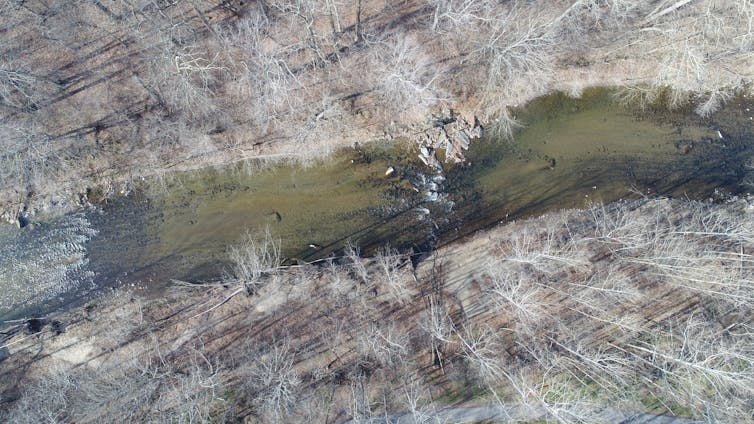
 Aerial image of the Patapsco River channel showing gravel, cobble and sand deposits.
Matthew Baker/UMBC
Although it’s easy to observe evidence of sediment erosion from riverbanks or hillsides, it’s often unclear where and how much of that sediment is redeposited and stored. Management of sediment storage, particularly behind dams, can be somewhat controversial[11].
After studying several other dam removals[12], we expect sediment trapped behind the dam to rapidly evacuate and redistribute downstream over a period of several years.
However, there’s still much we don’t know. Floods following intense storms can move huge quantities of sediment, altering the valley bottom in just hours. Will such storms redeposit sediment elsewhere in the gorge or the coastal floodplain, or deliver it to the bay?
New ways to track changes
It’s logistically difficult to accurately measure large and potentially rapid channel changes.
In a typical field survey, technicians measure water depth, flow, bottom substrate and other information at specific locations. Though stream channels can vary tremendously over space as well as through time, we scientists are rarely able to represent such variability in our measurements. Instead, we collect isolated snapshots in time. That leaves us with less understanding of dynamic sediment movement, devastation wrought by flood waves or the diversity of conditions necessary to support aquatic life.
Gauging stations located upstream and downstream of the dam measure water flow and estimate suspended material like fine silts and clays, but not coarser sands and gravels moving along the channel bottom. Surveys of 30 cross-sections distributed over eight miles provide information about how channel shape and composition vary as one crosses the channel, but relatively little about the thousands of feet in between each transect.
What’s more, after a major flood, scientists must conduct new cross-sectional surveys, taking up to a month in occasionally in risky conditions.
Our team is attempting to add to our measurements by deploying small, off-the-shelf drones that photograph the entire valley bottom. Repeat photographs before, during and after removal can help us track the location of a sediment plume as it moves downstream. They also allow new perspectives of the river.
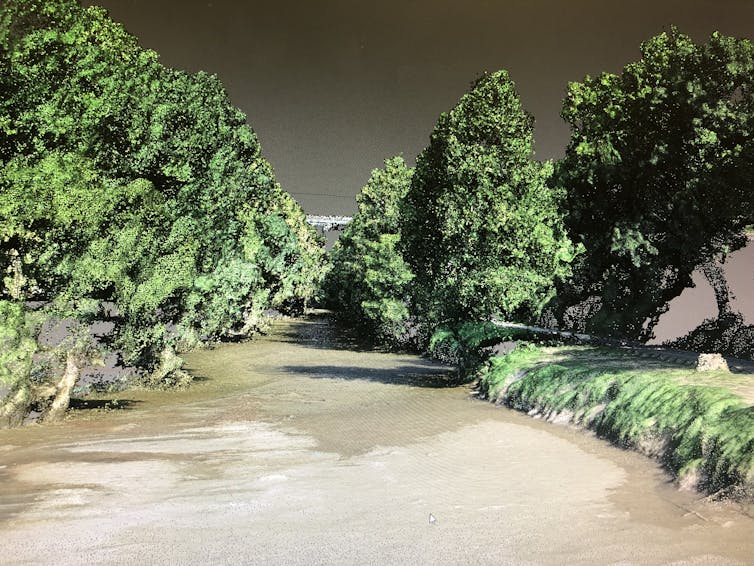
 3D view of a Patapsco River channel point cloud.
Matthew Baker/UMBC
Relying solely on overlapping photos collected both before and after dam removal, we will create 3D computer models[13] of the channel bottom and water depth – not just at the surveyed cross-sections, but every few inches along the channel. Although this technology works best in shallow water, our models should allow us to vastly improve estimates of both the amount and location of channel change as sediment moves downstream.
3D view of the Patapsco River point cloud.With the new approach, our team collects a photo set of all eight miles in just a few days, and further work occurs within a desktop computer. That means measurements can be repeated or made anew at any time using archived images.
Although we are certainly curious to see how this much sediment moves, we are especially interested in how well we can capture it. If it works, this technology will likely change the way scientists collect measurements and monitor rivers.
References
- ^ state (dnr.maryland.gov)
- ^ American Rivers (www.americanrivers.org)
- ^ Patapsco Valley (books.google.com)
- ^ Elkridge Landing (archive.org)
- ^ Periodic floods (www.washingtonpost.com)
- ^ catastrophic (www.washingtonpost.com)
- ^ flash floods (www.baltimoresun.com)
- ^ Ellicott City (www.baltimoresun.com)
- ^ sediment movement (www.sciencedirect.com)
- ^ can also be a pollutant (www.chesapeakebay.net)
- ^ somewhat controversial (www.ydr.com)
- ^ several other dam removals (onlinelibrary.wiley.com)
- ^ will create 3D computer models (onlinelibrary.wiley.com)
Authors: Matthew E. Baker, Professor of Geography and Environmental Systems, University of Maryland, Baltimore County

