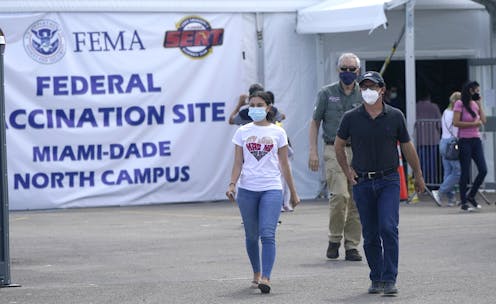
US vaccine rollout was close to optimal at reducing deaths and infections, according to a model comparing 17.5 million alternative approaches
- Written by Audrey L. McCombs, PhD. Candidate in Ecology and Statistics, Iowa State University

The Research Brief[1] is a short take about interesting academic work.
The big idea
The Centers for Disease Control and Prevention’s plan for who gets vaccines and in what order saved nearly as many lives and prevented nearly as many infections[2] as a theoretically perfect rollout, according to a new mathematical model we developed to assess the rollout of COVID–19 inoculations in the U.S.
In December 2020, with a limited number of vaccines available, the CDC had to make a hard decision: Who gets the COVID-19 vaccines first? It decided to divide the U.S. population into four groups[3] for vaccine prioritization based on age, occupation, living condition and known COVID-19 risk factors.
Using a new model and an Iowa State University supercomputer, we compared the real–world CDC recommendations with 17.5 million possible strategies that also staggered the rollout in up to four phases. To calculate how well a vaccine allocation strategy performed, our model measured total deaths, cases, infections and years of life lost.
We found that the CDC allocation strategy performed exceptionally well – within 4% of perfect[4] – in all four measures.
According to our model, the CDC’s decisions[5] to not vaccinate children initially and prioritize health care and other essential workers over nonessential workers were both correct. But our model also showed that giving individuals with known risk factors earlier access to vaccines would have led to slightly better outcomes.
No single rollout was able to simultaneously minimize deaths, cases, infections and years of life lost. For example, the strategy that minimized deaths led to a higher number of cases. Given these limitations, the CDC plan did a good job of balancing the four goals of vaccination and was particularly good at reducing deaths.
Why it matters
Many other studies[6] have looked at a small number of alternative COVID-19 vaccine rollouts[7]. Our project incorporated more characteristics of the current pandemic and considered 17.5 million possible strategies. We believe this gives our results more authority.
Our model includes differences in disease severity and susceptibility[8] to the coronavirus due to age. It also incorporates social distancing levels that change over time, as well as variable infectivity rates[9] to account for more contagious virus strains such as the delta variant.
All this gave us the ability to accurately assess the CDC’s past decisions. But the greater value of our modeling approach lies in how it could help guide future policy.
By changing model inputs, we were able to show how optimal rollout strategies should change given different vaccine hesitancy rates[10] and for different vaccines that can protect in different ways against infection or death[11]. For countries that are currently planning COVID-19 vaccination strategies[12], our model could help decision-makers develop the most effective strategies given their local resources and specifics. And even in the U.S., our modeling technique can inform allocation strategies for booster shots and future vaccine rollouts so health care administrators can make the best use of limited resources.
What still isn’t known
Any model is a simplification of reality. Our model did not account for re-infections[13] or varying levels of vaccine hesitancy[14] based on socio-economic status, political ideology or race. We also assumed that the level of hesitancy was constant over time.
Additionally, some important factors for how the coronavirus spreads – like contact rates between individuals of different age and demographic groups[15] and the contagiousness of asymptomatic[16] and vaccinated individuals – are still unknown. Better data on these parameters would improve the accuracy of our results.
What’s next
Now that we have the model built, we can extend it. For example, we can study how waning immunity[17] and booster shots might affect the spread of the disease. Our computer code is available to the public[18], and we hope it will guide health care policymakers in the U.S. and around the world.
References
- ^ Research Brief (theconversation.com)
- ^ saved nearly as many lives and prevented nearly as many infections (doi.org)
- ^ divide the U.S. population into four groups (www.cdc.gov)
- ^ within 4% of perfect (doi.org)
- ^ CDC’s decisions (www.cdc.gov)
- ^ Many other studies (doi.org)
- ^ a small number of alternative COVID-19 vaccine rollouts (doi.org)
- ^ differences in disease severity and susceptibility (doi.org)
- ^ variable infectivity rates (doi.org)
- ^ vaccine hesitancy rates (doi.org)
- ^ protect in different ways against infection or death (doi.org)
- ^ currently planning COVID-19 vaccination strategies (graphics.reuters.com)
- ^ re-infections (doi.org)
- ^ varying levels of vaccine hesitancy (dx.doi.org)
- ^ contact rates between individuals of different age and demographic groups (doi.org)
- ^ the contagiousness of asymptomatic (www.cdc.gov)
- ^ waning immunity (www.cdc.gov)
- ^ available to the public (github.com)
Authors: Audrey L. McCombs, PhD. Candidate in Ecology and Statistics, Iowa State University

