What is a margin of error? This statistical tool can help you understand vaccine trials and political polling
- Written by Ofer Harel, Professor of Statistics, University of Connecticut
In the last year, statistics have been unusually important in the news. How accurate is the COVID-19 test[1] you or others are using? How do researchers know the effectiveness of new therapeutics[2] for COVID-19 patients? How can television networks predict the election results[3] long before all the ballots have been counted?
Each of these questions involves some uncertainty, but it is still possible to make accurate predictions as long as that uncertainty is understood. One tool statisticians use to quantify uncertainty is called the margin of error.
 In the real world, it is impossible to test or sample every relevant person, so statisticians rely on smaller samples drawn from a population.
Guzaliia Filimonova/iStock via Getty Images Plus[4]
Limited data
I am a statistician[5], and part of my job is to make inferences and predictions. With unlimited time and money, I could simply test or survey the entire group of people I am interested in to evaluate the question in mind and find the exact answer. For example, to find out the COVID-19 infection rate in the U.S., I could simply test the entire U.S. population. However, in the real world, you can never access 100% of a population.
Instead, statisticians sample a small portion of the population and build a model to make a prediction. Using statistical theory, that result from the sample is extrapolated to represent the whole population.
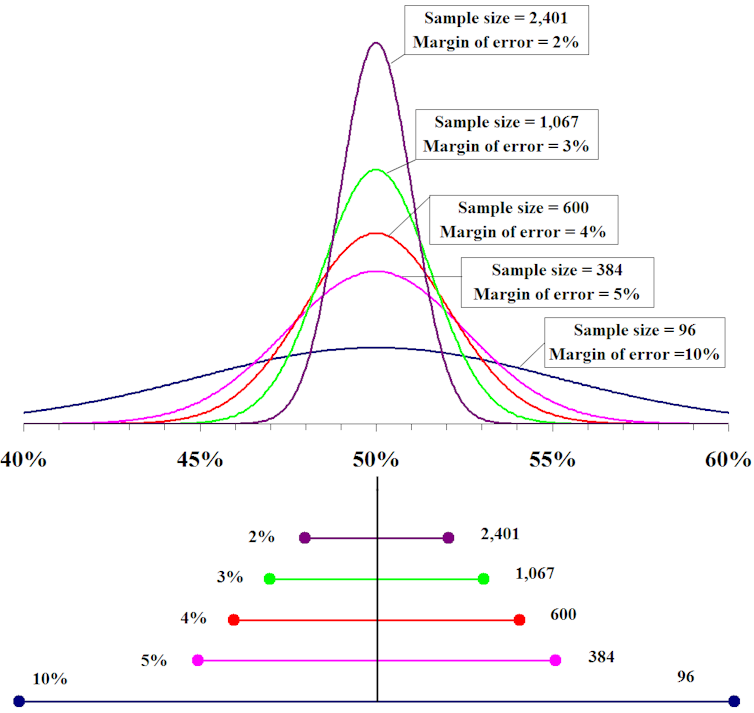
Ideally, a good sample should be representative of the total population, including gender, racial diversity, socioeconomic diversity, lifestyle patterns and other demographic measures. The larger the sample, the more similar it would be to the true population, and with a larger sample, the more confident statisticians become in their predictions. But there will always be some uncertainty.
 The larger the sample size, the more accurate the prediction and the smaller the margin of error.
Fadethree via Wikimedia Commons[6]
Quantifying uncertainty
Take drug development, for example. It is always true to predict that a new medication will be somewhere between 0% and 100% effective for everyone on Earth. But that isn’t a very useful prediction. It is a statistician’s job to narrow that range to something more useful. Statisticians usually call this range a confidence interval, and it is the range of predictions within which statisticians are very confident the true number will be found.
If a medication was tested on 10 individuals and seven of them found it effective, the estimated drug efficacy is 70%. But since the goal is to predict the efficacy in the whole population, statisticians need to account for the uncertainty of testing only 10 people.
[The Conversation’s science, health and technology editors pick their favorite stories. Weekly on Wednesdays[7].]
Confidence intervals are calculated using a mathematical formula that encompasses the sample size, the range of responses and the laws of probability. In this example, the confidence interval would be between 42% and 98% – a range of 56 percentage points. After testing only 10 people, you could say with high confidence that the drug is effective for between 42% and 98% of people in the whole population.
If you divide the confidence interval in half, you get the margin of error – in this case, 28%. The larger the margin of error, the less accurate the prediction. The smaller the margin of error, the more accurate the prediction. A margin of error that is almost 30% is still quite a wide range.
However, imagine that the researchers tested this new drug on 1,000 people instead of 10 and it was effective in 700 of them. The estimated drug efficacy is still going to be around 70%, yet this prediction is much more accurate. The confidence interval for the larger sample will be between 67% and 73% with a margin of error of 3%. You could say this drug is expected to be 70% effective, plus or minus 3%, for the entire population.
Statisticians would love to be able to predict with 100% accuracy the success or failure of a new medication or the exact outcomes of an election. However, this is not possible. There is always some uncertainty, and the margin of error is what quantifies that uncertainty; it must be considered when looking at results. In particular, the margin of error defines the range of predictions within which statisticians are very confident the true number will be found. An acceptable margin of error is a matter of judgment based on the degree of accuracy required in the conclusions to be drawn.
References
- ^ accurate is the COVID-19 test (theconversation.com)
- ^ effectiveness of new therapeutics (theconversation.com)
- ^ predict the election results (www.vox.com)
- ^ Guzaliia Filimonova/iStock via Getty Images Plus (www.gettyimages.com)
- ^ I am a statistician (scholar.google.com)
- ^ Fadethree via Wikimedia Commons (en.wikipedia.org)
- ^ Weekly on Wednesdays (theconversation.com)
Authors: Ofer Harel, Professor of Statistics, University of Connecticut

