COVID-19 shutdowns are clearing the air, but pollution will return as economies reopen
- Written by Daniel Cohan, Associate Professor of Environmental Engineering, Rice University
With many economies locked down to slow the spread of coronavirus, people from Beijing[1] to Los Angeles[2] have noticed bluer skies and less smog. Photos from Punjab[3] and Nairobi[4] reveal mountains that had been shrouded in haze for years. Satellites show cleaner air extending across broad swaths of Asia[5], Europe[6] and North America[7].
These stunning images reflect how the air is changing as the world confronts COVID-19. People are staying home, driving less and taking fewer flights and cruises. This crisis provides a unique experiment to see how the atmosphere responds as nations cut their emissions.
The air is getting cleaner, although these blue skies may be temporary. But it isn’t getting cooler. The buildup of greenhouse gas pollution continues[8], and global temperatures are still rising[9].
Why this difference? As an atmospheric scientist[10], I see it as an illustration of the contrasting challenges posed by air pollution and climate change.
Although cities around the world are seeing the clearest skies in decades, 2020 is still on track to be the warmest year on record.The view from above
You may have seen maps in the news showing blotches of air pollution that have shrunk since economies started shutting down in the past few months. Most of those maps are plotted from satellite observations of nitrogen dioxide, or NO2, a gas that triggers respiratory illnesses such as asthma[11]. It also reacts in the air to form other types of pollution, such as smog, haze and acid rain.
Nitrogen dioxide can be observed from space because it absorbs unique slivers of sunlight’s rainbow of colors. Those observations tell us a lot about what’s happening on Earth.
Some NO2 comes from natural sources like lightning and soils. Those aren’t affected by the current crisis. What has changed is the amount of pollution coming from burning fossil fuels, especially in cars, airplanes and ships.
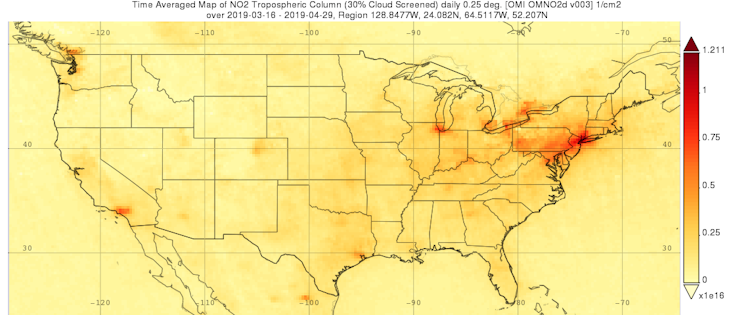
You can see the impacts of those reductions in satellite observations comparing NO2 concentrations over the United States in the spring of 2020 with the same period in 2019. They show that pollution levels are declining far more sharply over urban regions, where human sources of NO2 tend to dominate, than rural ones.
 CC BY-ND[12]
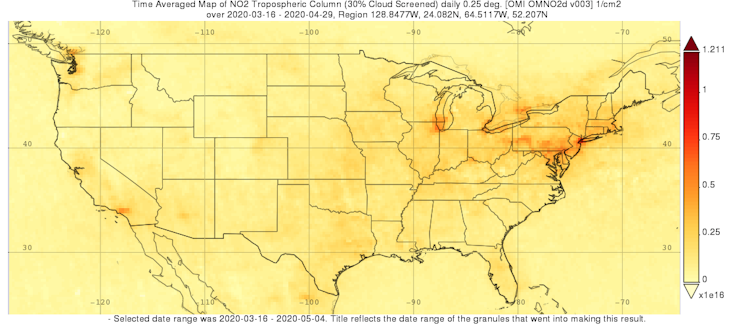 Nitrogen dioxide over the United States from March 16 to April 29 in 2019 (top) and 2020 (bottom).
Both images from Daniel Cohan, via NASA Giovanni, CC BY-ND[13][14]
Haze at ground level
In addition to images from space, many people are sharing photos that show haze giving way to blue skies and clearer views of landmarks and mountains. These reflect another change: declining levels of particulate air pollution.
Particles are tiny bits of soot and other substances floating in the air. They too come from a wide range of natural and man-made sources, including fossil fuel combustion, cooking meat, wildfires, trees and dust. As with nitrogen dioxide, the COVID-19 crisis provides an unplanned opportunity to better understand the sources of particulate matter.
This is important because particles are responsible for most of the 4.2 million deaths[15] that outdoor air pollution causes globally each year. Those deaths come from respiratory ailments, as well as heart attacks and strokes, since particles can be small enough to pass through the lungs into the bloodstream.
There’s even some preliminary evidence that exposure to particulate matter[16] and nitrogen dioxide[17] may make people more vulnerable to dying from COVID-19, although major uncertainties remain and more research is needed.
No COVID cooling
So what about carbon dioxide, or CO2, the leading cause of global warming? As we breathe cleaner air and see less haze, is that falling too?
Unfortunately, no.
Some observers estimate that the global response to COVID-19 could cause CO2 emissions in 2020 to fall by about 8%, which would be the sharpest drop in modern history[18]. But unlike the temporary improvements we’re seeing in nitrogen dioxide and particulate matter, the decline in CO2 emissions won’t reduce total atmospheric concentrations of CO2.
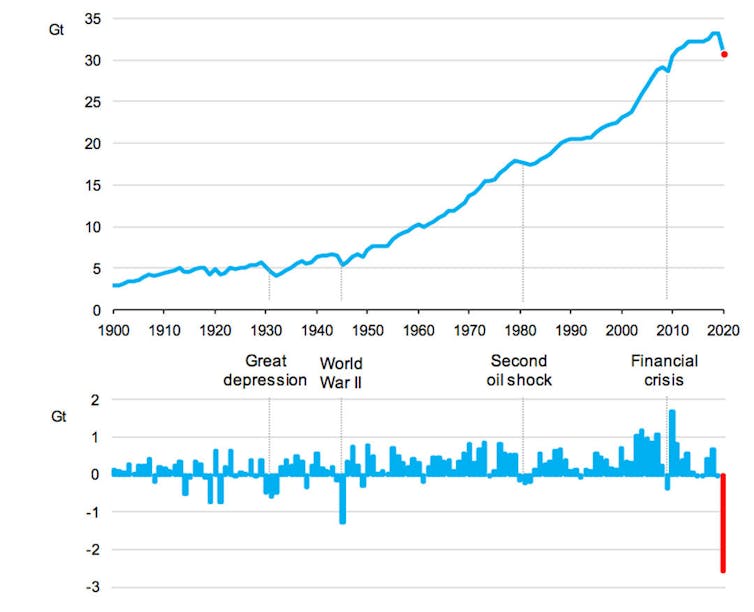 Global emissions (top) and annual change (bottom) of carbon dioxide from energy use, in gigatons.
IEA Global Energy Review 2020, CC BY-NC[19][20]
That’s because CO2 can stay in the air for centuries, while most other pollutants last for only days before they rain out or chemical reactions break them down. Carbon dioxide levels in the air will stabilize only when emissions reach a “net-zero” balance, in which sources are not emitting more CO2 than carbon sinks, such as vegetation, oceans and carbon-capturing devices, can remove.
This year’s declines will be nowhere near enough to achieve that balance. So carbon dioxide levels in the atmosphere are still rising[21], albeit at a somewhat slower rate than they would under business as usual. So are temperatures.
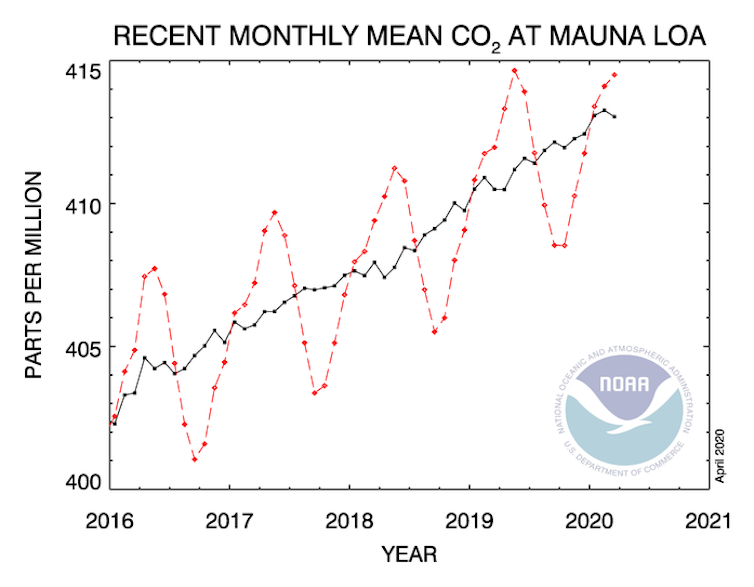 Levels of carbon dioxide in the air continue to increase.
NOAA[22]
Even as billions of people around the world stayed home and fossil-fuel-powered economies slowed down, March 2020 was the second-warmest March on record[23].
Paradoxically, it’s possible that responses to COVID-19 could actually cause a temporary bump in warming because of the way in which particles impact climate.
While CO2 traps the Earth’s heat, many types of particles reflect sunlight away from Earth, which provides a cooling effect. Lower particle pollution levels will allow more sunlight to reach the Earth’s surface. That could temporarily accelerate warming[24], although scientists are uncertain how strong that effect might be[25].
Coincidentally, 2020 marks the start of a global effort to cut sulfur emissions from ships[26]. Those emissions are a leading source of particles over the oceans[27]. Together, cleaner ships and less fossil fuel use this year will provide an unprecedented test of how climate responds to particles.
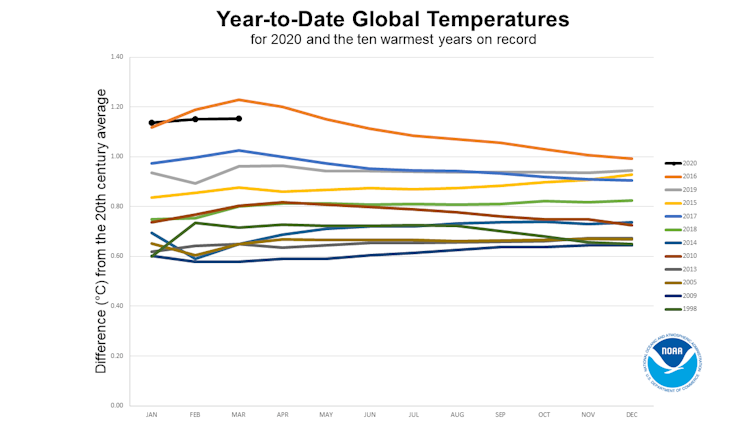 This March was the second hottest on record, even though carbon dioxide emissions fell.
NOAA[28]
What lies ahead
What does all of this mean for air and climate beyond the current crisis? Air pollution can return as quickly as it faded if fossil fuel use rebounds. In fact, nitrogen dioxide levels are already beginning to rise[29] over China as its lockdown eases.
Meanwhile, long-lasting carbon dioxide will continue to accumulate, making it difficult to stabilize the climate even as nations work to cut emissions. Only technologies, policies and investments that replace fossil fuels with energy efficiency and clean fuels can sustainably achieve cleaner air and a stable climate.
[Get facts about coronavirus and the latest research. Sign up for The Conversation’s newsletter.[30]]
References
- ^ Beijing (www.youtube.com)
- ^ Los Angeles (www.space.com)
- ^ Punjab (www.cnn.com)
- ^ Nairobi (www.npr.org)
- ^ Asia (www.nytimes.com)
- ^ Europe (www.space.com)
- ^ North America (www.cnn.com)
- ^ continues (www.esrl.noaa.gov)
- ^ still rising (www.ncdc.noaa.gov)
- ^ atmospheric scientist (scholar.google.com)
- ^ asthma (www.lung.org)
- ^ CC BY-ND (creativecommons.org)
- ^ Both images from Daniel Cohan, via NASA Giovanni (giovanni.gsfc.nasa.gov)
- ^ CC BY-ND (creativecommons.org)
- ^ 4.2 million deaths (www.who.int)
- ^ particulate matter (projects.iq.harvard.edu)
- ^ nitrogen dioxide (dx.doi.org)
- ^ sharpest drop in modern history (www.carbonbrief.org)
- ^ IEA Global Energy Review 2020 (www.iea.org)
- ^ CC BY-NC (creativecommons.org)
- ^ still rising (www.esrl.noaa.gov)
- ^ NOAA (www.esrl.noaa.gov)
- ^ second-warmest March on record (www.ncei.noaa.gov)
- ^ temporarily accelerate warming (doi.org)
- ^ uncertain how strong that effect might be (www.ipcc.ch)
- ^ cut sulfur emissions from ships (www.imo.org)
- ^ over the oceans (earthzine.org)
- ^ NOAA (www.ncdc.noaa.gov)
- ^ already beginning to rise (www.esa.int)
- ^ Sign up for The Conversation’s newsletter. (theconversation.com)
Authors: Daniel Cohan, Associate Professor of Environmental Engineering, Rice University

