R0: How scientists quantify the intensity of an outbreak like coronavirus and its pandemic potential
- Written by Joseph Eisenberg, Professor and Chair of Epidemiology, University of Michigan
If you saw the 2011 movie “Contagion[1],” about a worldwide pandemic of a new virus, then you’ve heard the term R0.
Pronounced “R naught,” this isn’t just jargon made up in Hollywood. It represents an important concept in epidemiology and is a crucial part of public health planning during an outbreak, like the current coronavirus epidemic spreading outward from China.
Scientists use R0 – the reproduction number[2] – to describe the intensity of an infectious disease outbreak. R0 estimates have been an important part of characterizing pandemics or large publicized outbreaks, including the 2003 SARS pandemic[3], the 2009 H1N1 Influenza pandemic[4] and the 2014 Ebola epidemic in West Africa[5].
How much will a disease spread?
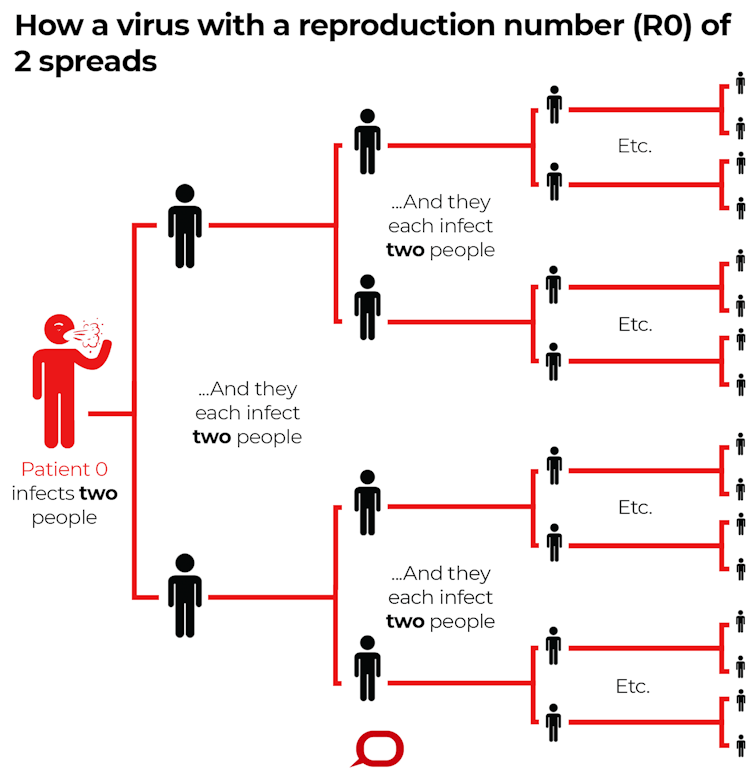
The formal definition of a disease’s R0 is the number of cases, on average, an infected person will cause during their infectious period.
 R0 describes how many cases of a disease an infected person will go on to cause – in this imagined scenario R0=2.
The Conversation, CC BY-ND[6]
The term is used in two different ways.
The basic reproduction number represents the maximum epidemic potential of a pathogen. It describes what would happen if an infectious person were to enter a fully susceptible community, and therefore is an estimate based on an idealized scenario.
The effective reproduction number depends on the population’s current susceptibility. This measure of transmission potential is likely lower than the basic reproduction number, based on factors like whether some of the people are vaccinated against the disease, or whether some people have immunity due to prior exposure with the pathogen. Therefore, the effective R0 changes over time and is an estimate based on a more realistic situation within the population.
It’s important to realize that both the basic and effective R0 are situation-dependent[7]. It’s affected by the properties of the pathogen, such as how infectious it is. It’s affected by the host population – for instance, how susceptible people are due to nutritional status or other illnesses that may compromise one’s immune system. And it’s affected by the environment, including things like demographics, socioeconomic and climatic factors.
For example, R0 for measles ranges from 12 to 18[8], depending on factors like population density and life expectancy. This is a large R0, mainly because the measles virus is highly infectious.
On the other hand, the influenza virus is less infectious, with its R0 ranging from 2 to 3[9]. Influenza, therefore, does not cause the same explosive outbreaks as measles, but it persists due to its ability to mutate and evade the human immune system.
What makes R0 useful in public health?
Demographer Alfred Lotka proposed the reproduction number in the 1920s, as a measure of the rate of reproduction in a given population.
In the 1950s, epidemiologist George MacDonald suggested[10] using it to describe the transmission potential of malaria. He proposed that, if R0 is less than 1, the disease will die out in a population, because on average an infectious person will transmit to fewer than one other susceptible person. On the other hand, if R0 is greater than 1, the disease will spread.
When public health agencies are figuring out how to deal with an outbreak, they are trying to bring R0 down to less than 1. This is tough for diseases like measles that have a high R0. It is especially challenging for measles in densely populated regions[11] like India and China, where R0 is higher, compared to places where people are more spread out.
For the SARS pandemic in 2003[12], scientists estimated the original R0 to be around 2.75. A month or two later, the effective R0 dropped below 1, thanks to the tremendous effort that went into intervention strategies, including isolation and quarantine activities.
However, the pandemic continued. While on average, an infectious person transmitted to fewer than one susceptible individual, occasionally one person transmitted to tens or even hundreds of other cases. This phenomenon is called super spreading[13]. Officials documented super spreader events a number of times during the SARS epidemic in Singapore, Hong Kong and Beijing.
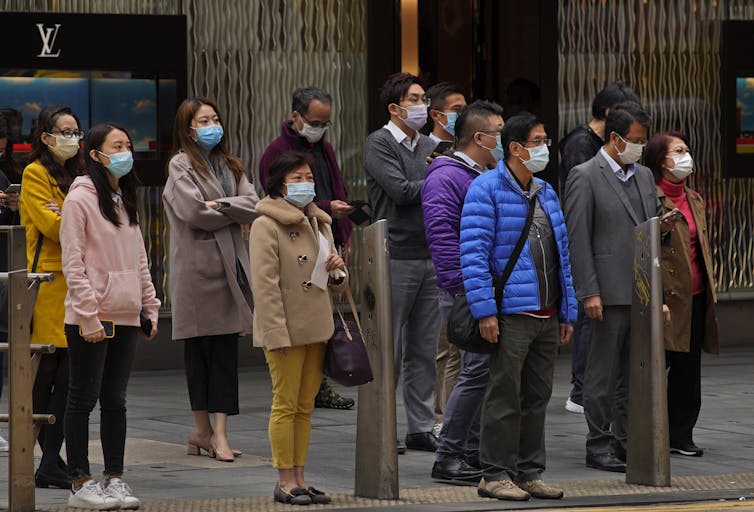
 People in Hong Kong, concerned about coronavirus spreading from mainland China, wear face masks in February 2020.
AP Photo/Vincent Yu[14]
R0 for coronavirus spreading from China
A number of groups have estimated R0 for this new coronavirus. The Imperial College group has estimated R0 to be somewhere between 1.5 and 3.5[15]. Scientists from the Chinese Academy of Sciences Institute of Automation and the University of Chinese Academy of Sciences have estimated R0 to be much higher, at 4.08[16].
These differences are not surprising; there’s uncertainty about many of the factors go into estimating R0, such as in estimating the number of cases, especially early on in an outbreak.
Based on these current estimates, projections of the future number of cases of coronavirus are fraught with high levels of uncertainty and will likely be somewhat inaccurate.
The difficulties arise for a number of reasons.
First, the basic properties of this viral pathogen – like the infectious period – are as yet unknown.
Second, researchers don’t know how many mild cases or infections that don’t result in symptoms have been missed by surveillance but nevertheless are spreading the disease.
Third, the majority of people who come down with this new coronavirus do recover, and are likely then immune to coming down with it again. It’s unclear how the changing susceptibility of the population will affect the future spread of infection. This is especially important in Wuhan, the origin of the epidemic[17].
Finally, and likely the most important reason, no one knows the future impacts of current disease control measures. Epidemiologists’ current estimates of R0 say nothing about how measures such as isolation or quarantine efforts will influence the virus’ future spread.
[ You’re smart and curious about the world. So are The Conversation’s authors and editors. You can get our highlights each weekend[18]. ]
References
- ^ Contagion (www.imdb.com)
- ^ the reproduction number (doi.org)
- ^ 2003 SARS pandemic (www.jstor.org)
- ^ 2009 H1N1 Influenza pandemic (doi.org)
- ^ 2014 Ebola epidemic in West Africa (doi.org)
- ^ CC BY-ND (creativecommons.org)
- ^ basic and effective R0 are situation-dependent (dx.doi.org)
- ^ R0 for measles ranges from 12 to 18 (doi.org)
- ^ its R0 ranging from 2 to 3 (doi.org)
- ^ epidemiologist George MacDonald suggested (doi.org)
- ^ especially challenging for measles in densely populated regions (www.cdc.gov)
- ^ SARS pandemic in 2003 (doi.org)
- ^ is called super spreading (theconversation.com)
- ^ AP Photo/Vincent Yu (www.apimages.com)
- ^ somewhere between 1.5 and 3.5 (www.imperial.ac.uk)
- ^ much higher, at 4.08 (doi.org)
- ^ the origin of the epidemic (www.cdc.gov)
- ^ You can get our highlights each weekend (theconversation.com)
Authors: Joseph Eisenberg, Professor and Chair of Epidemiology, University of Michigan

