Inequality is higher in some states like New York and Louisiana because of corporate welfare
- Written by Joshua Jansa, Assistant Professor of Political Science, Oklahoma State University

Income inequality made[1] big[2] headlines[3] recently, after the U.S. Census Bureau[4] released new data showing that the gap between the richest and poorest Americans is at its highest level in at least half a century[5].
Less reported was the significant variation among the states[6]. New York and California had the highest inequality in 2018, while Utah and Alaska had the lowest. In addition, states as diverse as Alabama, Texas and New Hampshire experienced large increases from the prior year.
Why are some states more or less equal than others?
It usually comes down to policies. States with more generous welfare programs[7] and higher minimum wages[8] often have lower inequality, while those with weaker unions[9] and lower taxes on the rich[10] have higher levels.
My research suggests[11] there’s another, less-noticed reason behind the disparities: corporate welfare.
Incentivizing inequality
States offer economic development incentives to businesses in order to encourage their investment and expansion in the state.
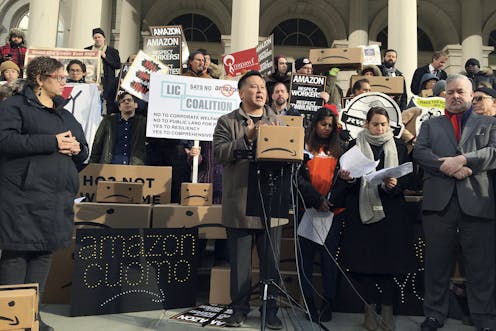
Famously, hundreds of states and cities offered[12] Amazon property and income tax credits, bonds, grants, reimbursements and infrastructure assistance in their efforts to convince the Internet giant to open a “second” headquarters in one of their cities. One of the finalists even offered to provide Amazon with a private train car[13]. New York and Virginia won the sweepstakes with a combined US$2 billion in incentives[14] – although Amazon dropped New York after it met political resistance.
But the amount of incentives states offer can vary significantly. For example, New Hampshire spent just $9.9 million on incentives, or 75 cents for every state resident, per year from 1999 to 2014, while Louisiana paid out an average of $1.2 billion a year, or $267 per capita.
I wanted to know if how much a state spends on corporate incentives affects its level of income inequality. So I analyzed incentive spending using Good Jobs First[15] data and income inequality as measured by the Gini coefficient[16] from 1999 to 2014.
The Gini coefficient measures inequality by assigning a decimal number that can range from 0, which represents perfect equality, to 1, meaning perfect inequality. New York had a Gini of 0.513 in 2018, while Utah’s was 0.426. A change in the Gini coefficient of as little as 0.01 means the top 10% of households earned $1,500 to $2,400 more per year, depending on the state.
I found that when states spend more on incentives, their level of inequality tends to spike within a year or so. This holds true even when controlling for other economic and demographic factors and other public policies.
The data showed that, on average, for every $180 per citizen that a state spends on incentives, the Gini coefficient increases by 0.004. In other words, $600 to $1,000 more winds up in the pockets of people from wealthy households.
In big-dollar terms, $180 per citizen is the equivalent of a state spending $200 million to $2 billion a year on incentives, depending on its population. To put it in context, states frequently give billion-dollar incentive packages to individual companies, such as Tesla[17], Nike[18], Intel[19], Boeing[20] and Nissan[21].
Incentives serve to redistribute funds to the wealthy and reduce resources for broadly redistributive policies over the long run.
The whole story
Incentives, of course, do not explain everything. New Hampshire, for example, has growing inequality but doesn’t spend much on incentives.
Yet, looking at incentives can help explain why states that are leaders in mitigating inequality[22] through higher minimum wages or welfare spending on the poor, such as New Mexico and New York, are still seeing growing inequality.
So the next time you hear an elected official cite big returns on investment[23] as their reason for offering a company billions in incentives to open a factory or office, remember they aren’t telling the whole story. Those big returns come at a cost: higher inequality, which in turn can hamper economic growth[24].
References
- ^ made (markets.businessinsider.com)
- ^ big (www.washingtonpost.com)
- ^ headlines (www.axios.com)
- ^ U.S. Census Bureau (www.census.gov)
- ^ highest level in at least half a century (www.npr.org)
- ^ significant variation among the states (data.census.gov)
- ^ more generous welfare programs (scholars.org)
- ^ higher minimum wages (csivc.csi.cuny.edu)
- ^ weaker unions (doi.org)
- ^ lower taxes on the rich (www.nytimes.com)
- ^ research suggests (jmjansa.files.wordpress.com)
- ^ hundreds of states and cities offered (www.nytimes.com)
- ^ a private train car (www.cnbc.com)
- ^ US$2 billion in incentives (www.nytimes.com)
- ^ Good Jobs First (www.goodjobsfirst.org)
- ^ Gini coefficient (data.census.gov)
- ^ Tesla (www.scientificamerican.com)
- ^ Nike (www.cnbc.com)
- ^ Intel (www.oregonlive.com)
- ^ Boeing (news.bloombergtax.com)
- ^ Nissan (www.goodjobsfirst.org)
- ^ leaders in mitigating inequality (scholars.org)
- ^ returns on investment (madison.com)
- ^ hamper economic growth (dx.doi.org)
Authors: Joshua Jansa, Assistant Professor of Political Science, Oklahoma State University

