Statistics ruined baseball by perfecting it
- Written by Edwin Amenta, Professor of Sociology, University of California, Irvine
Since sportswriter Henry Chadwick popularized the box score[1] in the 19th century, baseball fans have had a love affair with statistics. Many can recite records like Joe DiMaggio’s 56-game hitting streak, Rickey Henderson’s 130 stolen bases or Barry Bonds’ 73 home runs in one season. But have statistics ruined the game fans love?
In the new millennium, the statistical revolution forced baseball to double down on numbers. By looking deeper into the data, the far-sighted general manager Billy Beane of the Oakland Athletics converted a small-market team into a big winner – and in the process got to be played by Brad Pitt in the blockbuster film “Moneyball.”[2][3]
Soon fans had to learn new stats, dumping time-honored but not very revealing counts like pitcher wins and runs batted in, in favor of newfangled rates like wOBA[4] and xFIP[5]. But the statistical turn has changed how the game is played – and in far from fan-friendly ways. As someone who used stats to turn around a team[6], I know that they also have their downsides.
Longer, more tedious games
For one, stats awareness has lengthened the game. Since the analytical revolution, everyone in baseball now knows that lefty pitchers can more easily retire lefty batters. Often such a relief pitcher enters the game, with warm-ups and commercials, to face one batter, cueing more commercials.
The number of pitchers per game is at an all-time high[7]. Although the length of the game was down a few minutes last season from its peak in 2017, the average game still clocked in at three hours[8], half an hour longer than it was 40 years ago.
The game is also less exciting. Analytics showed that to steal a base, perhaps the most thrilling event in baseball, you have to be very good at it. Failing means making an out, and outs are precious. So baseball teams rarely do things that routinely results in outs. Last season, steal attempts dropped to their lowest level[9] since 1964. Rickey Henderson’s record is safe.
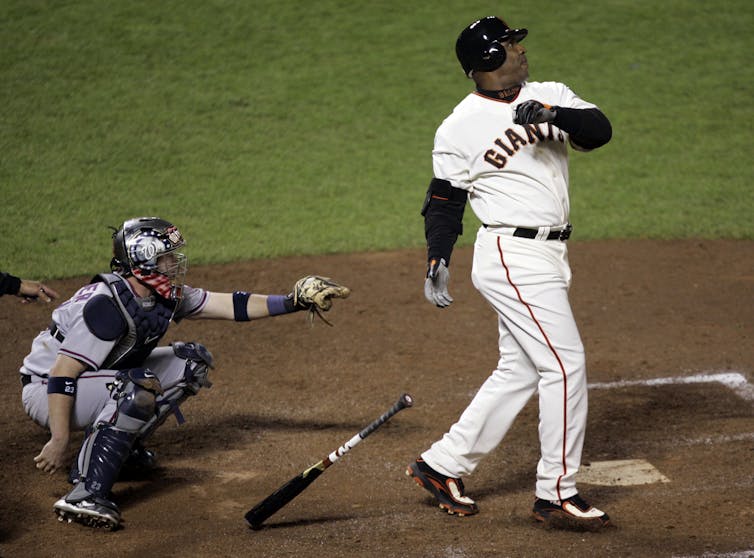
 Barry Bonds hits his 756th career home run.
AP Photo/Marcio Jose Sanchez[10]
Taking pitches and striking out
Because of stats, baseball also sees more and more of the “three true outcomes[11],” meaning that a player either strikes out, walks or hits a home run. The batter doesn’t have to run and fielders don’t have to field, so the game loses action.
Since “Moneyball,” all teams know that the walk is a valuable offensive asset and wears down pitchers. At the turn of the century during the steroids era, walks peaked, then declined as steroids were policed, but have trended upward[12] back to the steroid-era levels. The number of pitches per plate appearance is at an all-time high[13].
Little Leaguers fear nothing more than striking out. But professional hitters, and knowledgeable teams and fans, have learned that striking out is not that bad, if swinging harder increases chances at a home run. Homers are up to steroid-era levels[14]. Fans dig the long ball, though mainly like runs. However, the home run surge hasn’t resulted in more runs scored – just more of the same number of runs coming by way of homers, with runners trotting across home plate. With more players swinging for the fences, home runs are spread more evenly than in the past. No current player has any real chance of surpassing Bonds’s performance-enhanced records.
All outs count the same, whether by striking out or giving some defender a chance to make an exciting play. In 2018, four hitters cracked the top 10 for most strikeouts in a season[15].
For their part, pitchers know striking out a batter is valuable, as it eliminates the chances of a struck ball falling safely or leaving the yard. The recent jump in strikeouts is due to teams’ relying on relievers armed with two good pitches, the knowledge that they will pitch one inning tops and a corresponding willingness to pitch as hard as possible for that inning.
Pitchers who are converted from starters to one-inning relievers[16] strike out far more batters than they did as starters. Also, starters know that they are going to face fewer batters. So they hold less in reserve, and now whiff batters at higher rates, too. The season record for strikeouts was broken last year for the 11th season in a row[17].
Losing for the win (maybe)
 Billy Beane’s statistics-first approach kickstarted a new era of baseball.
AP Photo/Bill Kostroun[18]
Most of all, heightened stats awareness has made entire seasons miserable for the fans of the low-revenue teams that analytics initially were helping. After the success of the Oakland Athletics, the big-market organizations also learned how to play Moneyball. The Yankees, Cubs, Dodgers, Phillies and Red Sox – the defending World Series champions, who have won three times since hiring Bill James in 2003 – have lucrative local TV deals[19]. They also have top analytics departments. Their combination of money and analytical strength promises more World Series appearances in the 2020s.
Worse than that, many teams with lower local TV revenues and marginal rosters now use a stats-based strategy to lose on purpose[20] for several seasons for a chance at gaining two or three years of winning. The more losses, the higher the draft pick, and teams going through the tanking “process” will also trade their best players for a group of prospects, hoping to be competitive down the road.
A team can tank its way to the top[21], but it can take several seasons and is not an exact science. What is certain is that during the down years the team is often hard to watch. Take the Chicago White Sox. That team went into full tank mode two seasons ago, after losing not on purpose for several seasons, with another lost season[22] in store for 2019. Even if the White Sox eventually win, their window will likely not be open long. And because of revenue sharing to small-market teams, tanking franchises can still make money by reducing payroll. It’s win-win for the franchise, but lose-lose-maybe-win-lose for their fans.
Fixing the game
What is to be done? Major League Baseball has adopted only marginal changes[23]. Delays between innings have been shaved by five seconds. A rule for 2020 stipulates that a pitcher must face at least three batters or finish the inning – dooming the one-out reliever.
The MLB is considering instituting a 20-second pitch clock, which would speed up the game. But they also will increase rosters by a player, creating more room for one-inning relievers.
I think more drastic moves are needed to counter how stats have compounded boredom in baseball. The MLB needs to discourage tanking, shorten the game and make it more exciting. To do all that baseball should share more revenue, institute high minimum payrolls, reform the draft, prevent batters from leaving the box, reduce the number of pitchers and lower the mound.
But I believe that there’s little chance these steps will be taken. Attendance may be down[24], but revenues continue to increase[25]. More lucrative national TV deals are on the horizon, while losing teams can profit by having low payrolls. All those numbers suggest that little will change soon.
References
- ^ box score (www.npr.org)
- ^ converted a small-market team into a big winner (books.wwnorton.com)
- ^ the blockbuster film “Moneyball.” (www.imdb.com)
- ^ wOBA (m.mlb.com)
- ^ xFIP (library.fangraphs.com)
- ^ turn around a team (www.press.uchicago.edu)
- ^ all-time high (www.baseball-reference.com)
- ^ three hours (www.baseball-reference.com)
- ^ lowest level (www.mlb.com)
- ^ AP Photo/Marcio Jose Sanchez (www.apimages.com)
- ^ three true outcomes (www.theringer.com)
- ^ trended upward (www.baseball-almanac.com)
- ^ all-time high (www.baseball-reference.com)
- ^ steroid-era levels (www.baseball-almanac.com)
- ^ most strikeouts in a season (www.baseball-almanac.com)
- ^ one-inning relievers (fivethirtyeight.com)
- ^ the 11th season in a row (www.baseball-almanac.com)
- ^ AP Photo/Bill Kostroun (www.apimages.com)
- ^ lucrative local TV deals (www.statista.com)
- ^ lose on purpose (theconversation.com)
- ^ tank its way to the top (fivethirtyeight.com)
- ^ another lost season (www.fangraphs.com)
- ^ marginal changes (www.mlb.com)
- ^ down (www.baseball-reference.com)
- ^ revenues continue to increase (www.forbes.com)
Authors: Edwin Amenta, Professor of Sociology, University of California, Irvine
Read more http://theconversation.com/statistics-ruined-baseball-by-perfecting-it-113896

