From pledges to action: Cities need to show their climate progress with hard data
- Written by Conor K Gately, Postdoctoral Associate, Boston University
As world leaders negotiate rules for cutting greenhouse gas emissions at the COP24 meeting in Poland, U.S. cities have a vested interest in the outcome. About 85 percent of Americans live in cities, and urban areas produce some 80 percent[1] of our nation’s greenhouse gas emissions. Many cities are highly vulnerable to climate change impacts such as flooding and heat waves.
Cities are central to shaping effective solutions, too. After President Donald Trump announced in 2017 that he planned to withdraw the United States[2] from the Paris climate accord[3], more than 400 U.S. mayors[4] – representing 69 million people – pledged to fulfill it[5]. Some cities are going further and aiming for net carbon neutrality by 2050. Their efforts are sorely needed: According to a Dec. 5 report from the Global Carbon Project, global carbon dioxide emissions grew 2.7 percent in 2018[6], the largest rise in seven years.
Mayors believe they can make a climate impact[7] while making their communities greener and cleaner. To succeed, they will have to take bold policy actions and demonstrate that emissions are declining. However, tracking greenhouse gas emissions requires models, forecasting tools and lots of data. Today most of that information is organized at the national[8] or state level[9], not at city scales.
Now, though, this is changing. Over the last decade, our work on urban greenhouse gas emissions[10] has shown that with the right combination of instruments, data and modeling techniques[11], it is possible to independently quantify carbon dioxide[12] and methane[13] emissions from urban areas. Just as researchers measure local smog concentrations for public health, they now can measure local greenhouse gases for climate action.
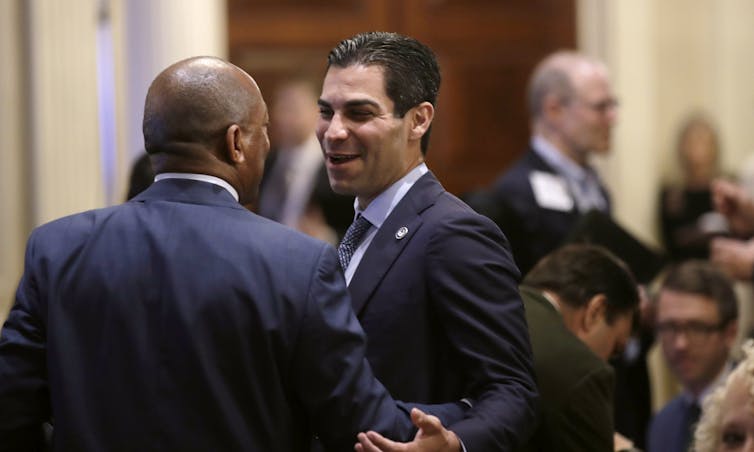
 Miami Mayor Francis Suarez, right, chats with Houston Mayor Sylvester Turner during the Boston Climate Summit, June 7, 2018.
AP Photo/Charles Krupa[14]
Move fast and measure carefully
Many steps cities need to take to hit their 2050 targets must be undertaken within the next decade[15]. Investments in energy systems, transportation infrastructure and new housing stock can lock in consumption and emissions patterns[16] for decades to come.
As an example, by reducing urban and suburban vehicle travel, making electric vehicles more affordable, and expanding use of public transit, cities can cut carbon emissions and also reduce local air pollution. But such actions require very long lead times. The much-anticipated Westside subway extension project[17] in Los Angeles has a construction timeline of 14 years, but was preceded by decades of planning and negotiation.
To track actual progress over time, urban agencies also need to generate and share local-scale information. Nongovernment organizations like the Carbon Disclosure Project[18] and ICLEI[19] have produced tools that make this kind of data more accessible and transparent, but it is still challenging to accurately quantify city-scale emissions[20]. Resource constraints, data gaps and shifting local priorities make it difficult for many cities to regularly report emissions in a consistent way.
We work with a growing network of U.S. cities[21] where researchers are quantifying greenhouse gas emissions across urban regions. For example, in Boston we are analyzing how trees within the city[22] influence greenhouse gas levels, and how local traffic congestion increases emissions[23] of carbon dioxide as well as air pollutants. And in Salt Lake City, researchers have outfitted train lines[24] with sensors to measure greenhouse gases and air quality in real time.
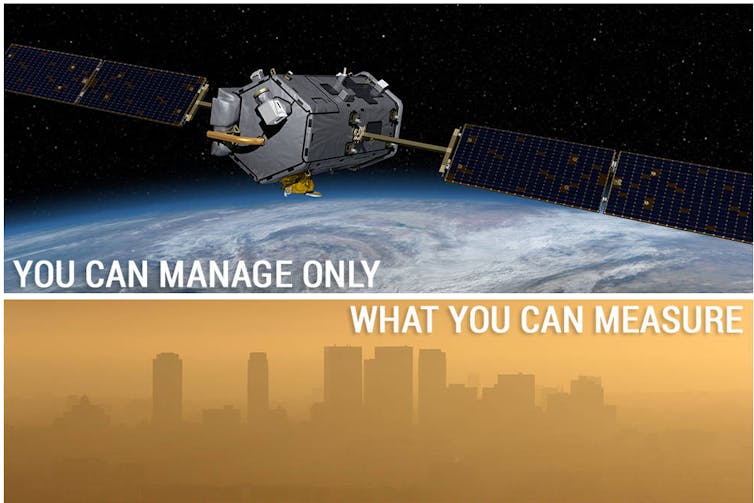
Remote sensing is another promising data source. Several greenhouse gas observing satellites[25] are already in orbit[26], with more to follow[27]. The Orbiting Carbon Observatory 3 (OCO-3)[28], soon to be installed on the International Space Station, will focus on observing cities and urban areas across the globe. It will provide scientists and city governments regularly with vital data on local carbon dioxide concentrations.
Scientists can use models like this one from NASA’s Orbiting Carbon Observatory (OCO-2) satellite to better understand and predict where CO2 concentrations could be especially high or low, based on activity on the ground.Avoiding surprises
Regular air measurements aren’t just valuable for measuring progress. They also can help researchers identify unknown emissions sources through “atmospheric detective work,” spotting sources that aren’t well controlled or illicit “dumping” of pollutants into the atmosphere.
This happened in 2014, when scientists using satellite instruments to monitor atmospheric methane concentrations detected a giant methane hotspot[29] in northwestern New Mexico that did not appear in any existing emissions inventories. A targeted field campaign using aircraft and ground-based sensors narrowed down the source to leaks associated with oil and gas development in the San Juan Basin.[30].
More recently, atmospheric measurements published in May 2018 detected a rapid increase[31] in concentrations of a chemical known as CFC-11 that had been targeted for phaseout under the 1987 Montreal Protocol on Substances That Deplete the Ozone Layer[32]. Using atmospheric models, researchers narrowed down the source region of these emissions to somewhere in East Asia.[33]. Investigations subsequently identified over 18 companies in China illicitly producing and selling CFC-11.[34].
 https://www.nasa.gov/content/you-can-manage-only-what-you-can-measure[35]
The problem with offsets
Cities are unlikely to cheat on their own pledges in this way, but they may use strategies that are hard to measure or verify. A key example is buying energy and carbon credits instead of directly reducing emissions. In these transactions, buyers receive credit for investing in renewable energy or other green initiatives, such as planting trees, to “offset” their own carbon-intensive activities.
Buying offsets is a popular way to show support for the environment. For example, the ride sharing company Lyft has pledged to buy enough carbon offsets that “every ride will now contribute to fighting climate change[36].” And cities may meet clean energy commitments by buying renewable energy credits[37] from power providers outside their limits.
Offset projects can be very cost-effective and important for reducing overall U.S. emissions, but they may not do anything for improving local air quality in cities. Those Lyft drivers will still be generating air pollution. So will the urban power plants that keep running while local governments buy green power credits from sources elsewhere. As these examples show, the more cities rely on offsets to meet their climate targets, the harder it will be to assess whether they are actually reducing their contributions to climate change.
You can’t manage what you can’t measure
To sustain momentum and achieve their climate goals, we believe U.S. cities should embrace the transparency and validation that direct measurements can provide to show that progress is real and not just on paper. In our view, it also is time for a major push to connect local climate action plans across cities with observations and data. Ambitious climate targets are a key first step, but now cities need to show their residents – and each other – that they are making verifiable progress.
References
- ^ some 80 percent (carbon2018.globalchange.gov)
- ^ withdraw the United States (www.nytimes.com)
- ^ Paris climate accord (unfccc.int)
- ^ 400 U.S. mayors (climatemayors.org)
- ^ pledged to fulfill it (www.wearestillin.com)
- ^ global carbon dioxide emissions grew 2.7 percent in 2018 (www.globalcarbonproject.org)
- ^ make a climate impact (www.surveyofmayors.com)
- ^ national (www.epa.gov)
- ^ state level (19january2017snapshot.epa.gov)
- ^ urban greenhouse gas emissions (scholar.google.com)
- ^ instruments, data and modeling techniques (scholar.google.com)
- ^ carbon dioxide (doi.org)
- ^ methane (doi.org)
- ^ AP Photo/Charles Krupa (www.apimages.com)
- ^ undertaken within the next decade (dx.doi.org)
- ^ lock in consumption and emissions patterns (doi.org)
- ^ Westside subway extension project (www.metro.net)
- ^ Carbon Disclosure Project (www.cdp.net)
- ^ ICLEI (icleiusa.org)
- ^ accurately quantify city-scale emissions (doi.org)
- ^ growing network of U.S. cities (sites.bu.edu)
- ^ trees within the city (www.citylab.com)
- ^ increases emissions (doi.org)
- ^ outfitted train lines (www.ksl.com)
- ^ Several greenhouse gas observing satellites (science.sciencemag.org)
- ^ in orbit (www.tropomi.eu)
- ^ more to follow (www.jpl.nasa.gov)
- ^ (OCO-3) (www.jpl.nasa.gov)
- ^ a giant methane hotspot (doi.org)
- ^ leaks associated with oil and gas development in the San Juan Basin. (doi.org)
- ^ a rapid increase (www.independent.co.uk)
- ^ Montreal Protocol on Substances That Deplete the Ozone Layer (www.state.gov)
- ^ somewhere in East Asia. (doi.org)
- ^ illicitly producing and selling CFC-11. (eia-global.org)
- ^ https://www.nasa.gov/content/you-can-manage-only-what-you-can-measure (www.nasa.gov)
- ^ every ride will now contribute to fighting climate change (medium.com)
- ^ buying renewable energy credits (www.c2es.org)
Authors: Conor K Gately, Postdoctoral Associate, Boston University

