Philadelphia has a lot more deadly shootings than expected for a big city − and NYC is much safer, new study says
- Written by Rayan Succar, Ph.D. Candidate in Mechanical and Aerospace Engineering, New York University

Recent high-profile mass shootings at SEPTA bus stations have left Philadelphia commuters on high alert[1]. Two gunmen opened fire at a bus stop in the Ogontz neighborhood on March 4, 2024, striking five people and killing 17-year-old Dayemen Taylor[2]. Two days later, a group of teenagers shot eight other teens[3] waiting at a bus stop near Northeast High School after school.
So far in 2024, 86 people[4] have been killed in Philadelphia – the vast majority of them after being shot. And yet, the city is still on track to have the lowest number of homicides since 2016, a sign of just how violent it has been in past years.
A new study[5] by New York University urban science researchers Rayan Succar[6] and Maurizio Porfiri[7] uses a methodology known as urban scaling to understand how violence in Philadelphia and other cities compares with what might be expected in cities based on their size. They answered the following questions for The Conversation.
What is urban scaling?
Big cities – filled with millions of people interacting with each other – are complex systems.
Urban scaling laws are used to explain how certain features of cities – from average salaries to road surface area to COVID infection rates – increase or decrease as population grows. These changes are not in direct relationship[8] to population increases and decreases. In other words, the relationship isn’t linear.
As surprising as it sounds, some quantities – the rate of homicides, for example – tend to increase even more than the rate of population growth. Mathematicians call this superlinear growth[9]. So, a larger population leads to a statistical increase not just in the number of homicides but in the rate of homicides relative to the population.
Other quantities, such as gun ownership and access, may grow at a slower rate as city population increases. This is called sublinear growth. Our study shows that the percentage of gun owners and accessibility, measured by the number of licensed gun sellers in a specific metro region, generally decreases as population increases.
To get a more nuanced view, urban scientists like us use a measure called the Scale-Adjusted Metropolitan Indicator[10]. This indicator was originally proposed by Luis Bettencourt[11], an urban scientist at the University of Chicago and the Santa Fe Institute. It takes into account nonlinear scaling patterns observed in cities, allowing for a more accurate comparison of different urban areas.
For our study, we used the SAMI to rank 833 U.S. metro areas in terms of homicide rates. We collected data on local rates of gun ownership, accessibility and the prevalence of homicides from the Centers for Disease Control and Prevention and the Bureau of Alcohol, Tobacco, Firearms and Explosives. The data takes into account all guns owned – whether they were acquired legally or illegally.
How did Philly compare with other big cities?
Philadelphia has far fewer homes with firearms and fewer gun dealers than what its population would predict. And yet, Philadelphia still experiences a higher-than-expected rate of violence.
Among the nine cities with populations over 5 million, the Philadelphia metropolitan area – this includes Camden, New Jersey, and Wilmington, Delaware – had the second-largest deviation from what is expected from its size. Chicago had the largest deviation, meaning it was more violent than its size suggests by the largest amount.
For comparison with other cities of varying size, Detroit also has more violence than expected for its population, while Miami is about average, and Boulder is much safer than expected.
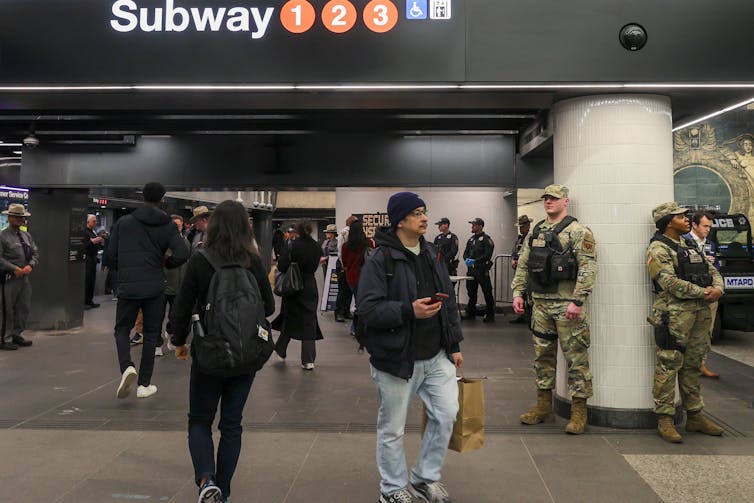
While often perceived as unsafe[13], New York City is actually significantly more safe than one might expect given its population. In fact, it ranks as the least violent of cities with more than 5 million people.
New York’s favorable scores suggest that efforts to reduce violence there have been successful, while efforts in Philadelphia aren’t working as well.
References
- ^ Philadelphia commuters on high alert (www.thetrace.org)
- ^ 17-year-old Dayemen Taylor (www.cbsnews.com)
- ^ shot eight other teens (www.cnn.com)
- ^ 86 people (www.phillypolice.com)
- ^ new study (www.nature.com)
- ^ Rayan Succar (scholar.google.com)
- ^ Maurizio Porfiri (scholar.google.com)
- ^ not in direct relationship (doi.org)
- ^ superlinear growth (doi.org)
- ^ Scale-Adjusted Metropolitan Indicator (doi.org)
- ^ Luis Bettencourt (www.luisbettencourt.com)
- ^ Selcuk Acar/Anadolu via Getty Images (www.gettyimages.com)
- ^ perceived as unsafe (www.vox.com)
Authors: Rayan Succar, Ph.D. Candidate in Mechanical and Aerospace Engineering, New York University

